Graphical analysis on DEPT:
Create view in Model Project.

Figure 1
Here we are going to create a read only view using a SQL query which is as followsselect count(empno),Sum(SAL),DEPTNO from emp group by DEPTNO. We can use the query in the query section of configuration wizard of that view.
Figure 2
Add View in Application Module

Figure 3
Created view needs to be added with existing application module so that it becomes visible from user interface through data control.

Figure 4
We can change the default view name to any suitable name
Modifying Appearance

Figure 5
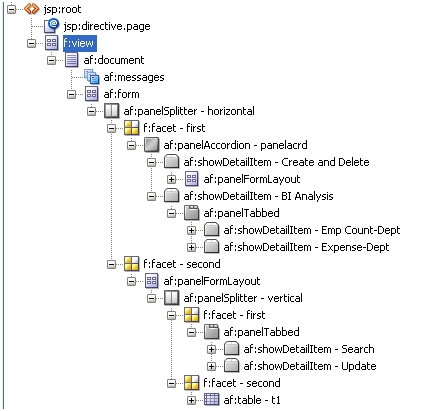
Previously only single "panelFormLayout" exists under "first" facet and that panelFormLayout holds entire form where we can create and delete employee, now we create a panelAccordion under first facet, which allow us to switch between more than one panel at runtime which comes under that panelAccordin. Here page structure becomes

Figure 7
Add Graph in Page

Figure 8
Select "GraphDeptViewObject" under "SampleAppModuleDataControl" and drag it to the region under "Emp Count-Dept" detail item. We will be prompted to use rich face from available rich faces. We need to select graph.

Figure 9
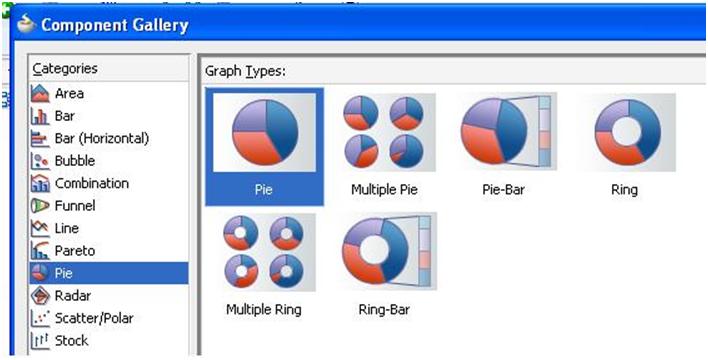
From a list of all available graph items I have taken pie as an example,

Figure 10
We need to monitor on number on employees on a particular department so each and every slice of pie corresponds to a department and the data points on that pie will be selected from a list of dropdown box that comes beside "Pie" label.

Figure 11
Click on Expenses- Dept tab and select "GraphDeptViewObject" under "SampleAppModuleDataControl" and drag it to the region under "Emp Count-Dept" detail item. We will be prompted to use rich face from available rich faces. We need to select graph. Here I have taken "Bar" as a display model.

Figure 12
We need to monitor total salary for each and every department so each bar pertaining to a department shows total salary and X axis depicts department.

Figure 13
This is the complete view of our resultant page.
Figure 14


Good attempt Anindya. This blog will help beginners to understand ADF
ReplyDelete